
Health care wait times in Canada – comparing the last three decades [Free infographic download]
By: Benefits by Design | Tuesday March 5, 2024
Updated : Tuesday February 3, 2026
Health care wait times in Canada have become a major topic over the last five years – and it’s no wonder. Overall, we are waiting much, much longer than we did 30 years ago. Our health care wait times infographic shows how things have changed over the last three decades, for better or for worse.
Download the 2023 Wait times for health care in Canada (PDF: 774 KB)
Median Health care wait times in Canada comparison
Canadians have become used to waiting for treatment. We wanted to know if this was a phenomenon brought on by the pandemic, or if we’ve been experiencing long health care wait times in Canada for a long time.
Canada overall
Over the years, there has been an increase in the number of weeks we wait between seeing our general practitioner about a health issue, to receiving the necessary treatment from a specialist.
In fact, over the last 30 years, there has been close to a 200% increase in the median number of weeks waited. However, the biggest increases were seen in the decade from 1993 to 2003, and the ten years between 2013 and 2023. Both those decades saw nearly 10 week increases. Whereas between 2003 and 2013, there was not even a week’s difference between median wait times.
It’s hard to pinpoint the exact causes of this fluctuation. Why would we see such dramatic increases in some decades and not others? One suggestion is the density of specialists. According to Statista, between 1993 and 2003, there was approximately 90 specialists per 100,000 Canadians. Whereas in the next ten years, that number rose to 108 specialists per 100,000, giving Canadians better access to specialists.
Percentage of Canadians waiting
Interestingly, despite the increase in health care wait times in Canada, the percentage of Canadians that are actually waiting for treatment has remained steady. The data wasn’t available for 1993, but since 2003, there has been between 2.66% and 3% of Canadians anxiously biding their time until their treatment can happen.
The number of specialists per 100,000 has increased to 123 since 2013. Which could lead one to believe that the wait times to see their specialist should be less. However, while an increase of just 0.34% of the population waiting for treatment doesn’t sound like a whole lot, when you add that to the fact that our population itself has also grown, you can see that the number of actual patients has increased.
Canadian population in 2013: 35,158,300 x 2.66% = 935, 211 Canadians waiting
Canadian population as of July 2023: 40,097,761 x 3.0% = 1,202,933 Canadians waiting
When analyzing these numbers to include the health care wait times in Canada, we can see how a slight increase in density of specialists isn’t enough to offset the growing population combined with the increase in the percentage of Canadians waiting.
Health care wait times by province
Each province is responsible for the health care of their constituents. Which means that each province has different issues and barriers that make the health care wait times in Canada differ from province to province.
People living in the Maritimes’ provinces are worse off than the rest of Canada in terms of receiving treatment. In fact, Nova Scotians will have to wait almost 57 weeks (just over a year) before they can finally get treated by a specialist. This wasn’t always the case. Back in 1993, PEI had the highest wait times, at 17.1 weeks. At the same time, all the other provinces were between 7.3 and 12.3 weeks wait.
Interestingly, in 2013, there was a decrease from 2003 in the weeks waited for Saskatchewan, Ontario, and Quebec. When we consider that the latter two provinces have the biggest populations, it’s easier to understand why there was such a small increase overall between 2003 and 2013.
Health care wait times in Canada by specialist
For the most part the weeks that Canadians must wait has increased since 1993. However, there were a few specialties that broke the mould.
Elective Cardiology being the most stand-out. In 1993, patients would wait about 18 weeks before receiving treatment. However, in 2013, that was all the way down to 10.3 weeks. And while the wait has gone back up, it remains almost 5 weeks less than 30 years ago.
Gynaecology has seen the largest increase overall with an additional 24.3 weeks of waiting since 1993. Need to see an otolaryngologist? You’ll be waiting an extra 20.9 weeks than you would have 30 years ago. Orthopaedic surgery saw the third largest increase at 19.3 weeks.
Waiting for diagnostic scans
Diagnostic tests are important in the discovery of illness, causes of chronic pain, and the diagnosis of disease. There wasn’t any data available for 1993, so we’ll focus on the last 20 years only.
When Canadians needed an MRI or CT scan in 2013, they waited less time than they did in both 2003 and now. These findings correlate with the decreases in wait times for some provinces in 2013, and the lower percentage of Canadians waiting that year. Overall, however, health care wait times in Canada for diagnostic scans have increased since 2003.
This isn’t our first or last time looking at wait times. Check out the current year, as well as previous year’s health care wait times infographics!
Free infographic: 2024 Wait times for health care in Canada/
Canadian Wait Times in Health Care – Free Infographic Download
How Increasing Health care Wait Times in Canada Impact Health Outcomes
Conclusion
Clearly Canadians are waiting too long before they can start their road to recovery. The Fraser Institute reports provide an acceptable number of weeks for each specialty that a patient should wait. Not one of the provinces is close to reaching that goal at this time. Yet with the combination of population growth and increase in the percentage of Canadians waiting, the status quo does not appear to be solving the wait times crisis.
Download the infographic now
2023 WAIT TIMES FOR HEALTH CARE IN CANADA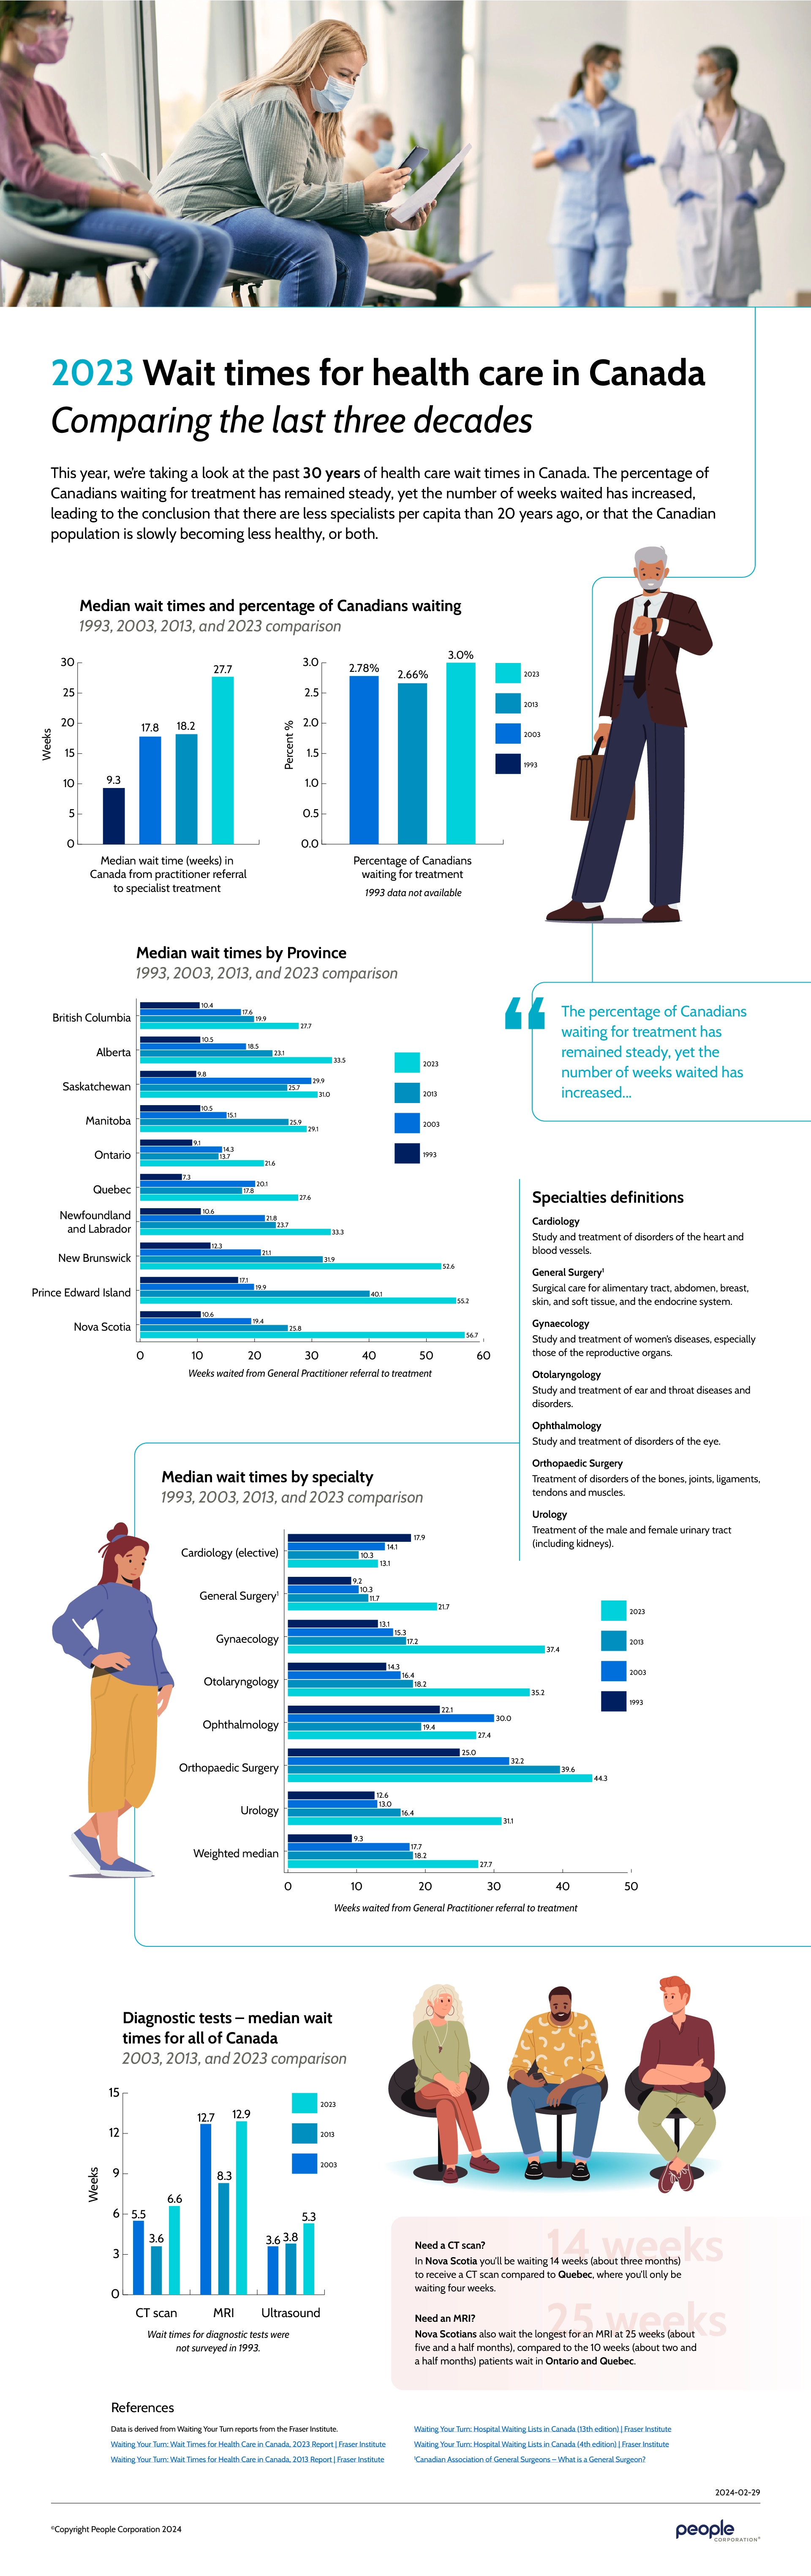
2023 WAIT TIMES FOR HEALTH CARE IN CANADA – COMPARING THE LAST THREE DECADES
This year, we’re taking a look at the past 30 years of health care wait times in Canada. The percentage of Canadians waiting for treatment has remained steady, yet the number of weeks waited has increased, leading to the conclusion that there are less specialists per capita than 20 years ago, or that the Canadian population is slowly becoming less healthy, or both.
Median wait times and percentage of Canadians waiting – 1993, 2003, 2013, and 2023 comparison
- Median wait time in Canada from practitioner referral to specialist treatment (in weeks): 1993 – 9.3, 2003 – 17.8, 2013 – 18.32, 2023 – 27.7
- Percentage of Canadians waiting for treatment: 1993 – data not available, 2003 – 2.78%, 2013 – 2.66%, 2023 – 30.%
(Weeks waited from General Practitioner referral to treatment)
Median wait times by province – 1993, 2003, 2013, and 2023 comparison
- British Columbia: 10.4, 17.6, 19.9, 27.7
- Alberta: 10.5, 18.5, 23.1, 33.5
- Saskatchewan: 9.8, 29.9, 25.7, 31.0
- Manitoba: 10.5, 15.1, 25.9, 29.1
- Ontario: 9.1, 14.3, 13.7, 21.6
- Quebec: 7.3, 20.1, 17.8, 27.6
- Newfoundland and Labrador: 10.6, 21.8, 23.7, 33.3
- New Brunswick: 12.3, 21.1, 31.9, 52.6
- Prince Edward Island: 17.1, 19.9, 40.1, 55.2
- Nova Scotia: 10.6, 19.4, 25.8, 56.7
(Weeks waited from General Practitioner referral to treatment)
Specialties definitions
Cardiology
Study and treatment of disorders of the heart and blood vessels.
General Surgery1
Surgical care for alimentary tract, abdomen, breast, skin, and soft tissue, and the endocrine system.
Gynaecology
Study and treatment of women’s diseases, especially those of the reproductive organs.
Otolaryngology
Study and treatment of ear and throat diseases and disorders.
Ophthalmology
Study and treatment of disorders of the eye.
Orthopaedic Surgery
Treatment of disorders of the bones, joints, ligaments, tendons and muscles.
Urology
Treatment of the male and female urinary tract (including kidneys).
Median wait times by specialty – 1993, 2003, 2013, 2023 comparison
- Cardiology: 17.9, 14.1, 10.3, 13.1
- General Surgery: 9.2, 10.3, 11.7, 21.7
- Gynaecology: 13.1, 15.3, 17.2, 37.4
- Otolaryngology: 14.3, 16.4, 18.2, 35.2
- Ophthalmology: 22.1, 30.0, 19.4, 27.4
- Orthopaedic Surgery: 25.0, 32.2, 39.6, 44.3
- Urology: 12.6, 13.0, 16.4, 31.1
- Weighted median: 9.3, 17.7, 18.2, 27.7
(Weeks waited from General Practitioner referral to treatment)
Diagnostic tests – median wait times for all of Canada
- CT scan: 5.5, 3.6, 6.6
- MRI: 12.7, 8.3, 12.96
- Ultrasound: 3.6, 3.8, 5.3
(Wait times for diagnostic tests were not surveyed in 1993)
In Nova Scotia you’ll be waiting 14 weeks (about three months) to receive a CT-Scan compared to Quebec, where you’ll only be waiting four weeks.
Need an MRI?
Nova Scotians also wait the longest for an MRI at 25 weeks (about five and a half months), compared to the 10 weeks (about two and a half months) patients wait in Ontario and Quebec.
References
Data is derived from Waiting Your Turn reports from the Fraser Institute.
- Waiting Your Turn: Wait Times for Health Care in Canada, 2023 Report | Fraser Institute:
Waiting Your Turn: Wait Times for Health Care in Canada, 2023 Report (fraserinstitute.org) - Waiting Your Turn: Wait Times for Health Care in Canada, 2013 Report | Fraser Institute:
- Waiting Your Turn: Wait times for Health Care in Canada, 2013 Report (fraserinstitute.org)
- Waiting Your Turn: Hospital Waiting Lists in Canada (13th edition) | Fraser Institute:
- Waiting Your Turn, Hospital Waiting Lists in Canada (13th Edition) (fraserinstitute.org)
- Waiting Your Turn: Hospital Waiting Lists in Canada (4th edition) | Fraser Institute:
- Waiting Your Turn: Hospital Waiting Lists in Canada (4th edition) (fraserinstitute.org)
- 1Canadian Association of General Surgeons: https://cags-accg.ca/patient-care/what-is-a-general-surgeon/