Drug trends findings from the annual TELUS benchmark reports
By: Benefits by Design | Tuesday June 25, 2024
Updated : Thursday February 5, 2026
This year’s TELUS drug trends benchmarking report compares findings between 2008 and now. This blog explores those trends, along with a deeper comparison to five years ago. Using data from both the 2024 report (which provides information on drug trends for 2023) and the 2019 report (which provides information on drug trends for 2018) we look at the differences and discuss the reasons for them.
Key Findings:
- Inflation isn’t the only culprit when it comes to the rising annual costs of prescription drugs. While the average amount per claim has only risen by about $10.00, the number of claims being made has increased significantly.
- Pharmacare programs have a significant impact on costs for private plans.
- The average age of insured has stopped going up due to more Millennials in the workforce and expanded immigration.
- Making more generic substitutions available has a bigger impact than drug formularies with mandatory generic drug substitutions.
- Specialty drugs share of total claims has plateaued.
Average number of claims, amount per claim, and amounts claimed per certificate
Compared to 5 years ago, the average number of claims made per certificate has gone up by almost 50%, from 10.3 to 15.1 claims. However, since the percentage of claimants has remained steady, hovering just below 60%, it’s hard to pinpoint exactly why there were so many more claims being made than previously. The increase in semaglutide prescriptions for both weight loss and diabetes could be a factor. Another possibility is the increase in anti-depressant use as mental health issues lose societal stigma.
At the same time, the average cost per claim has also risen compared to 2018, up more than $10 per claim, from $72.61 to $83.53. We believe this increase is due partly to inflation, and partly to the larger share of specialty drugs being used.
These two increases combined explain why the average annual amount claimed for prescription drugs (eligible amount per certificate) has more than doubled since 2018. Back then, it was just $448.80 per year, while in 2023, that amount was $1,262.
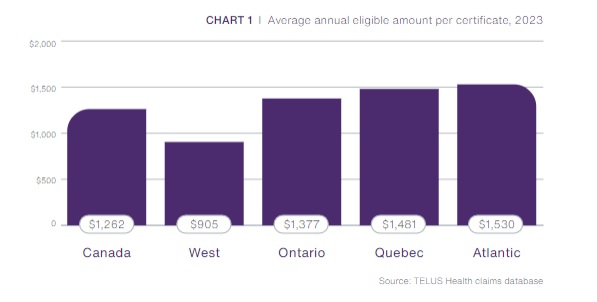
The average annual amount is also affected by Pharmacare programs.
Quebec saw smaller average claim amounts, but higher number of claims overall due to dispensing practices. Pharmacists often only dispense 30-day supplies instead of the more common 60- or 90-day supplies dispensed elsewhere.
Average age
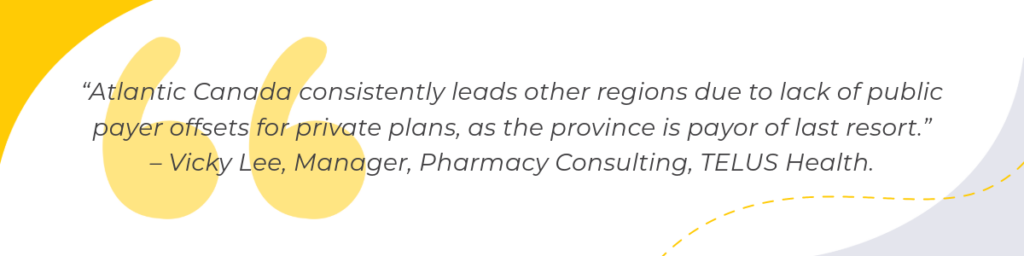
The average age of the certificate holder (employee) was slowly getting older as the Canadian population aged, reaching a high in 2019 at 44 years. However, even with baby boomers working beyond retirement age, the trend of workers getting older was offset by immigration and the increase in Millennials in the workforce. The average age has slowly gone down again and is now sitting at 42 years.
The percentage of the total amount claimed by age (share of eligible amount) was not available in the 2019 report – but compared to 15 years ago, the total share for claimants under 19 and between 20 and 44 has gone up. The study suggests this is due to more treatment options being available for younger workers (such as paramedical services) and more high-cost drugs being approved for adolescents and young adults.
Generic drugs trends and drug formularies
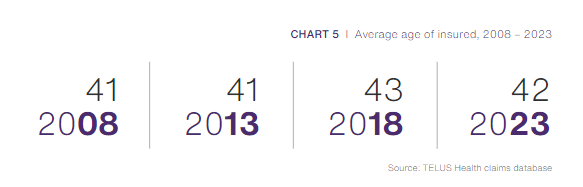
Since 2018, the adoption of mandatory generic benefit plans (drug formularies) doesn’t appear to have gone up very much. Why do we think this? While only 6.6% of claims in 2023 were for brand name drugs that had a generic alternative (multi-source brand), this is only a small improvement from 2018 where 7% of claims fell into this category.
At the same time, the utilization of brand name drugs with no generic substitute (single-source brand) went down by 4.1%. That’s down 10x more than multi-source brand drugs!
This suggests that having more generic drug options available in general has had a larger impact than the adoption of drug formularies by plan sponsors. According to the 2023 report, data from the US, where most plans include some form of drug formulary, generic drugs make up more than 80% of claims. This exemplifies the fact that more restrictive drug formularies can make a difference.
Specialty drugs vs. Traditional drug trends
There is some good news on the horizon for plan sponsors and insurers when it comes to drug coverage and stop-loss fees. For the last 15 years, specialty drug use has been rising steadily. In 2008, specialty drug claims represented 10.4% of the overall amount claimed (share of eligible amount) on both traditional and specialty drugs. This included just 0.5% of claimants. Today, the total share spent on specialty drugs is 31.2% (3x more), while the percentage of claimants is 1.8% (3.6x more). Leading us to the conclusion that specialty drug payment assistance programs, as well as Pharmacare programs has influenced these amounts. That, plus the fact that the government has changed regulations to help cap specialty drug pricing, has kept costs steady while the number of claimants has gone up.
Significantly, specialty drugs percent of total spend has finally plateaued at 31.2%, as biosimilars savings counteracted the release and use of new specialty drugs. Look to see savings continue as more biologicals lose patent rights. Private plans in western Canada benefit from Pharmacare first payor systems, as they have a smaller share of the total drug spend for specialty drugs.
The Canadian drug trends landscape has been shifting as specialty drugs became available for many different therapeutic classes. However, as costs soared, insurers, plan sponsors and the government have been looking at ways to combat this. Their hard work and dedication is starting to pay off, and it will be interesting to see how things shape up in the coming years.